

Arroyo is a stream processing engine that manages to be both lightweight and powerful—supporting SQL features like windows, joins, shuffles, and stateful aggregations, in just 10s of MBs of RAM. But production deployments have still required a distributed cluster and complex infrastructure like Kubernetes.
In 0.11 that changed, with the introduction of a deployment mode we call pipeline clusters. Pipeline clusters bundle up the control plane, data plane, and query logic into a single, easily deployed unit. And that makes them a great fit for deploying streaming pipelines on serverless infrastructure providers.
How is that possible? How can we run a stateful streaming pipeline on a serverless platform meant for stateless microservices? The secret ingredient is an object store. By checkpointing our state (for example the in-progress windowed data we’re aggregating over) and our config database (sqlite) to an object store like S3, we’re able to run consistent, stateful, correct streaming pipelines on unreliable, easily managed processing nodes.
To our knowledge, this is totally new—there is no other stateful streaming system that can run reliable pipelines on serverless infra. We think this has the possibility of greatly expanding the set of companies who are able to build real-time data pipelines, which has been our north star since founding Arroyo.
To show how easy (and affordable!) this is, I’m going to walk through how to run a streaming pipeline and a web app consuming from it on my favorite serverless platform, Fly.io.
Why do we like Fly so much? For one, we’re philosophically aligned. Fly also believes in solving hard technical problems (VMs that start in milliseconds! Globally-replicated databases! Serverless GPUs!) to simplify the operational experience of their users.
And with their recently-launched support for Tigris, an S3-compatible object store, it’s now a great place to run Arroyo.
In this tutorial, I’m going to walk through how to develop, test, and deploy a complete streaming application, from the data to a web app that visualizes it. Everything will run on Fly.io using the built-in support Tigris object store and Upstash Redis. And even better: with Arroyo’s minimal resource footprint, all of the compute can run within Fly’s free tier.
(Just want to see the code? Check out the git repo here.)
Table of Contents
Constructing the pipeline
To build a real-time data pipeline we’re going to need some real-time data. For your company it may be your weblogs, application events, or even sensor data from your network of oil and gas plants. But for this example we’ll use something that’s publicly available: Wikipedia’s recent changes stream, which reports events for every edit made to the site. Handily, it’s available as a server-sent events (SSE) API. SSE is a simple web data stream technology which is natively supported as a source in Arroyo.
We’re going to build a pipeline that
- Reads in the raw event data from Wikipedia
- Computes the top editors by number of changes over a sliding window
- Writes the results to Redis, where they’re consumed by a simple Python Flask web app
You can see the result running live at https://wiki-editors.fly.dev/.
Getting the data
To start with, we’ll build the SQL query that will find our top editors. This is easiest done with a local installation of Arroyo, so that we’re able to quickly iterate. On MacOS or Linux this is as easy as running
$ curl -LsSf https://arroyo.dev/install.sh | shor
$ brew install arroyosystems/tap/arroyoThen, you can start a cluster with
$ arroyo clusterand open the Web UI at http://localhost:5115.
(Don’t want to install Arroyo locally? You can also use the Docker image as described here.)
We’ll create a new pipeline by clicking the “Create Pipeline” button.
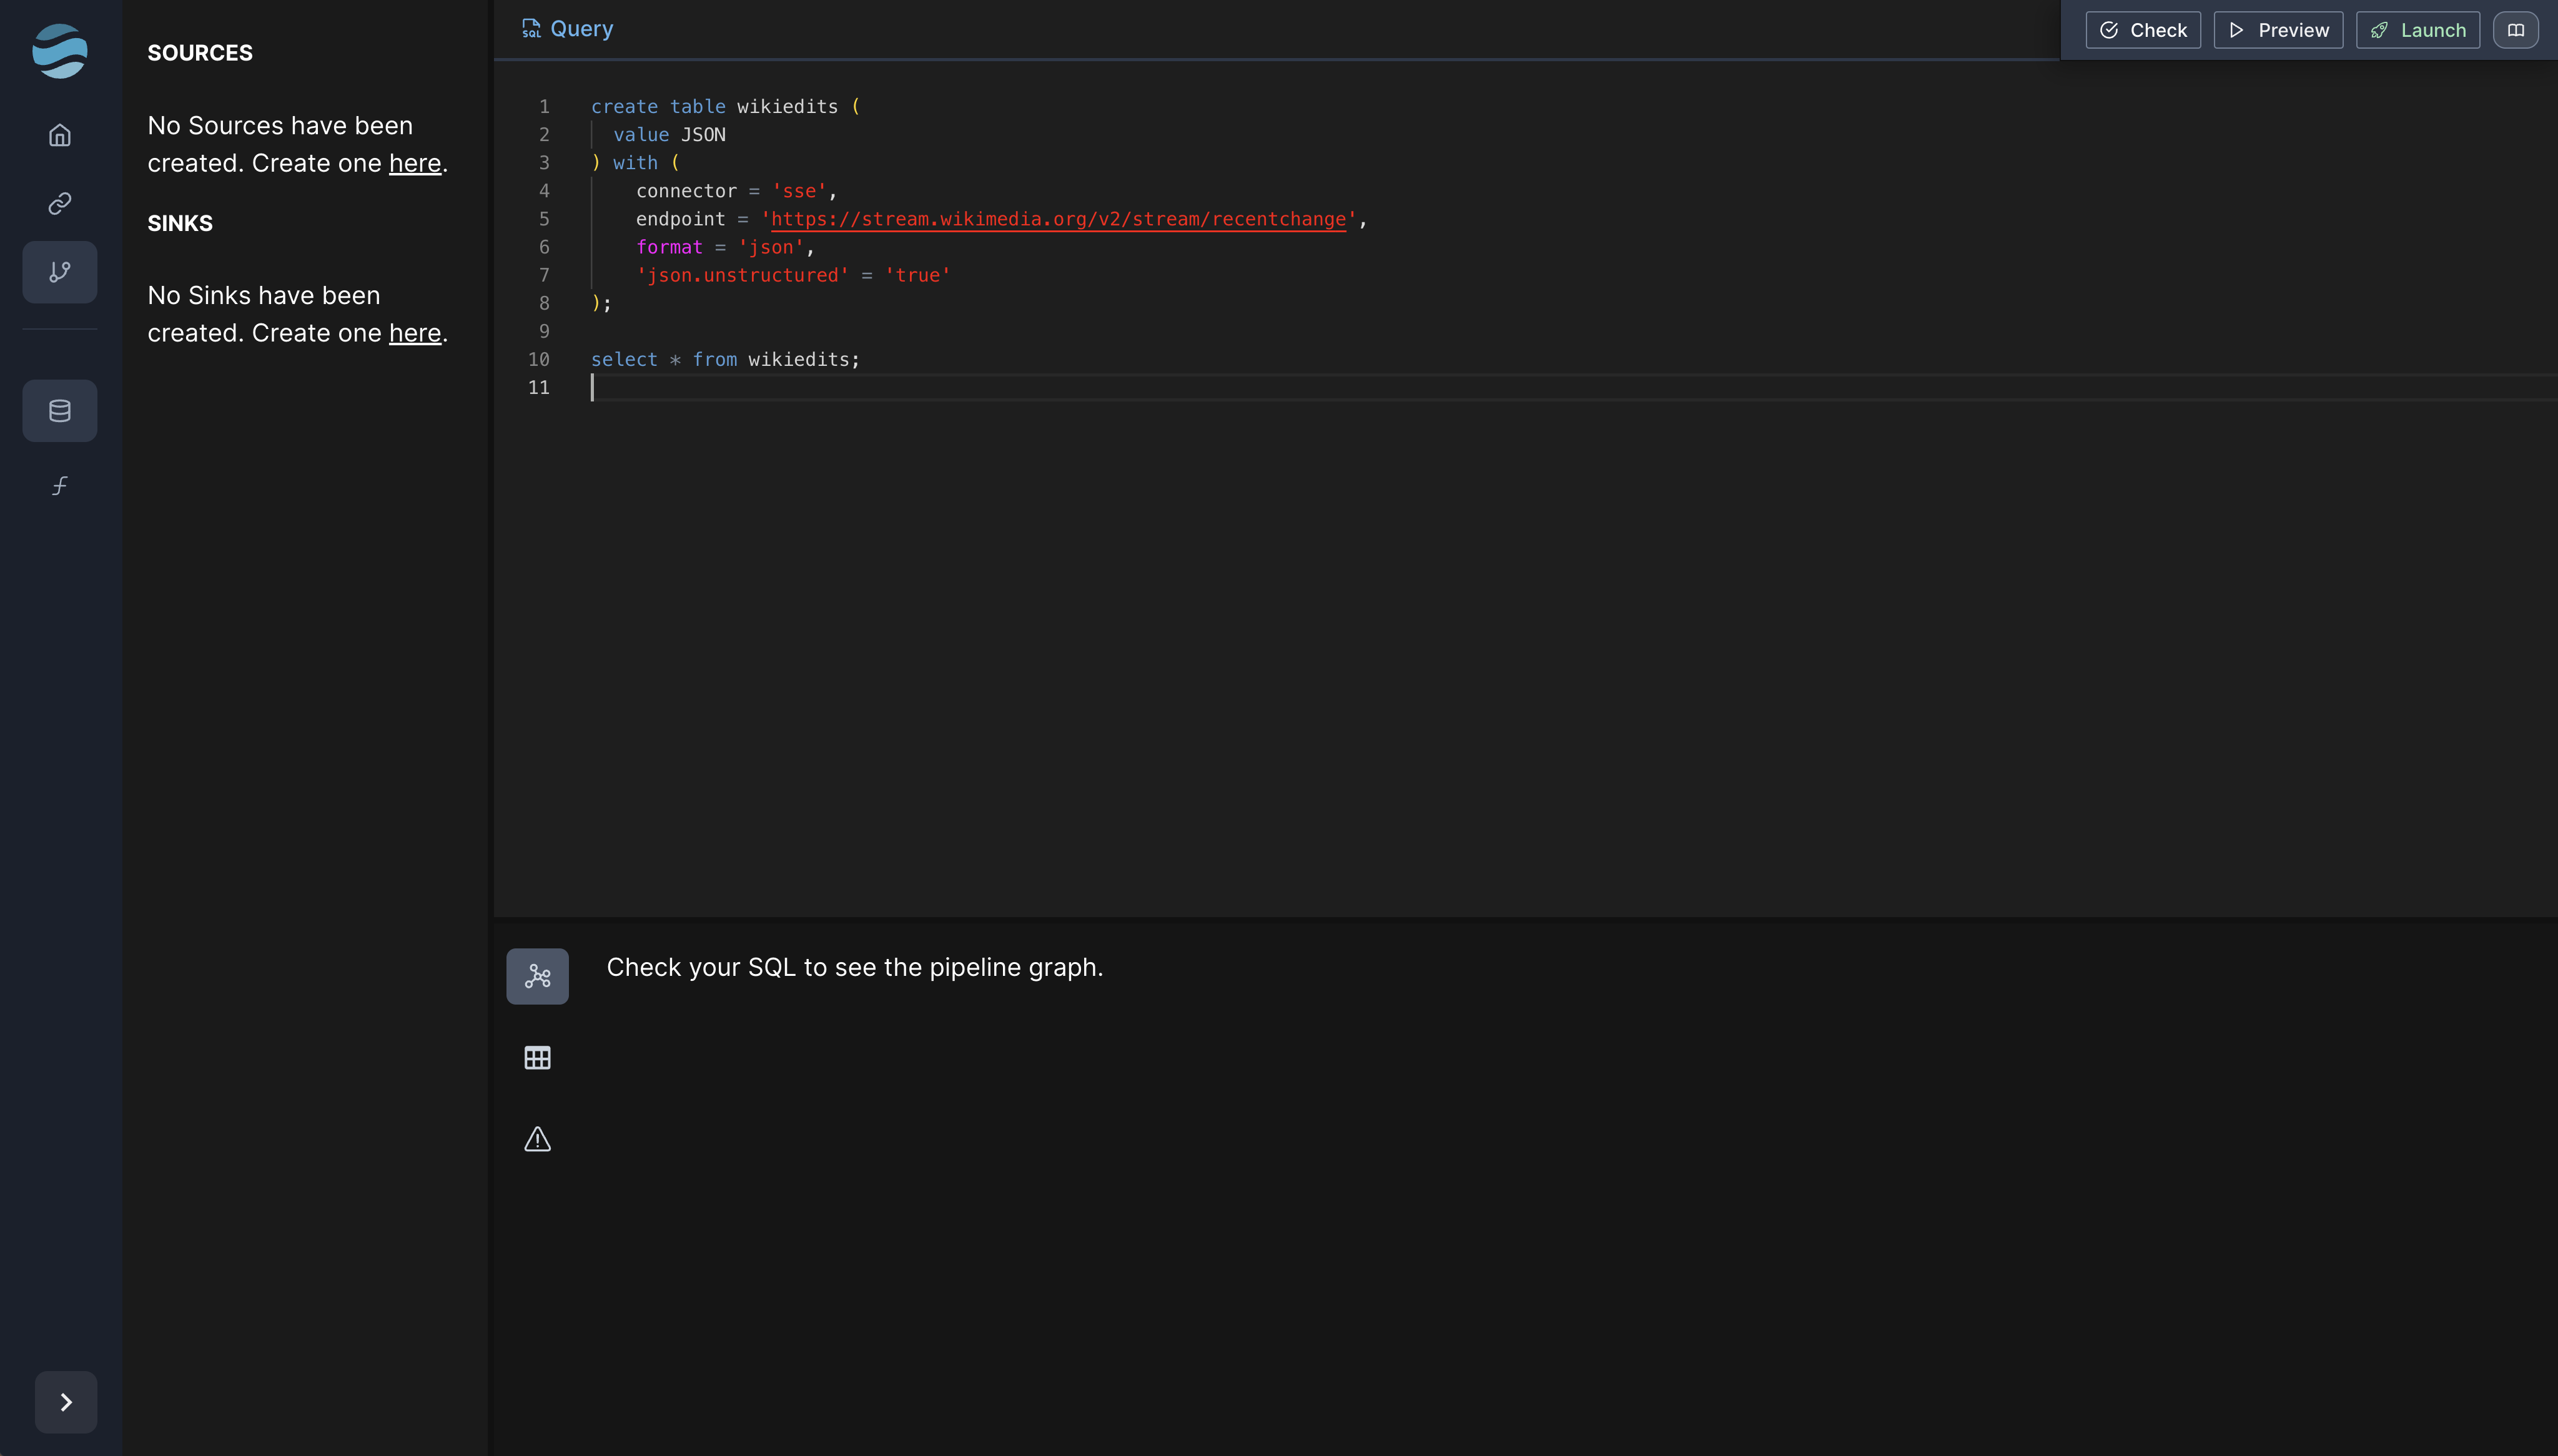
Arroyo pipelines are constructed by writing SQL queries in the pipeline editor
When writing a query, it’s helpful to get a sense of the data. We’ll create a source for the Server-Sent Events API but rather than giving it a schema, well start with “unstructured json,” which will let us inspect the events.
create table wikiedits (
  value JSON
) with (
    connector = 'sse',
    endpoint = 'https://stream.wikimedia.org/v2/stream/recentchange',
    format = 'json',
    'json.unstructured' = 'true'
);

select * from wikiedits;
Previewing this pipeline will produce a series of events. Looking at one of them, I see this:
{
  "$schema": "/mediawiki/recentchange/1.0.0",
  "meta": {
    "uri": "https://en.wikipedia.org/wiki/2009%E2%80%9310_Latvian_Hockey_League_season",
    "request_id": "63b46e6b-a40f-4893-811e-68988659a6f5",
    "id": "ca3645cb-c679-454c-bda9-c87081382b1e",
    "dt": "2024-08-03T21:44:45Z",
    "domain": "en.wikipedia.org",
    "stream": "mediawiki.recentchange",
    "topic": "eqiad.mediawiki.recentchange",
    "partition": 0,
    "offset": 5309152809
  },
  "id": 1804235781,
  "type": "edit",
  "namespace": 0,
  "title": "2009–10 Latvian Hockey League season",
  "title_url": "https://en.wikipedia.org/wiki/2009%E2%80%9310_Latvian_Hockey_League_season",
  "comment": "remove unused bgcolor in wikitable",
  "timestamp": 1722721485,
  "user": "WOSlinker",
  "bot": false,
  "notify_url": "https://en.wikipedia.org/w/index.php?diff=1238440330&oldid=1163178671",
  "minor": true,
  "length": {
    "old": 3641,
    "new": 3620
  },
  "revision": {
    "old": 1163178671,
    "new": 1238440330
  },
  "server_url": "https://en.wikipedia.org",
  "server_name": "en.wikipedia.org",
  "server_script_path": "/w",
  "wiki": "enwiki",
  "parsedcomment": "remove unused bgcolor in wikitable"
}
Ok, someone named “WOSlinker” is correcting some formatting in the article about the Lativian Hockey League, which I am informed (by wikipedia, of course) is the top level of ice hockey in Latvia.
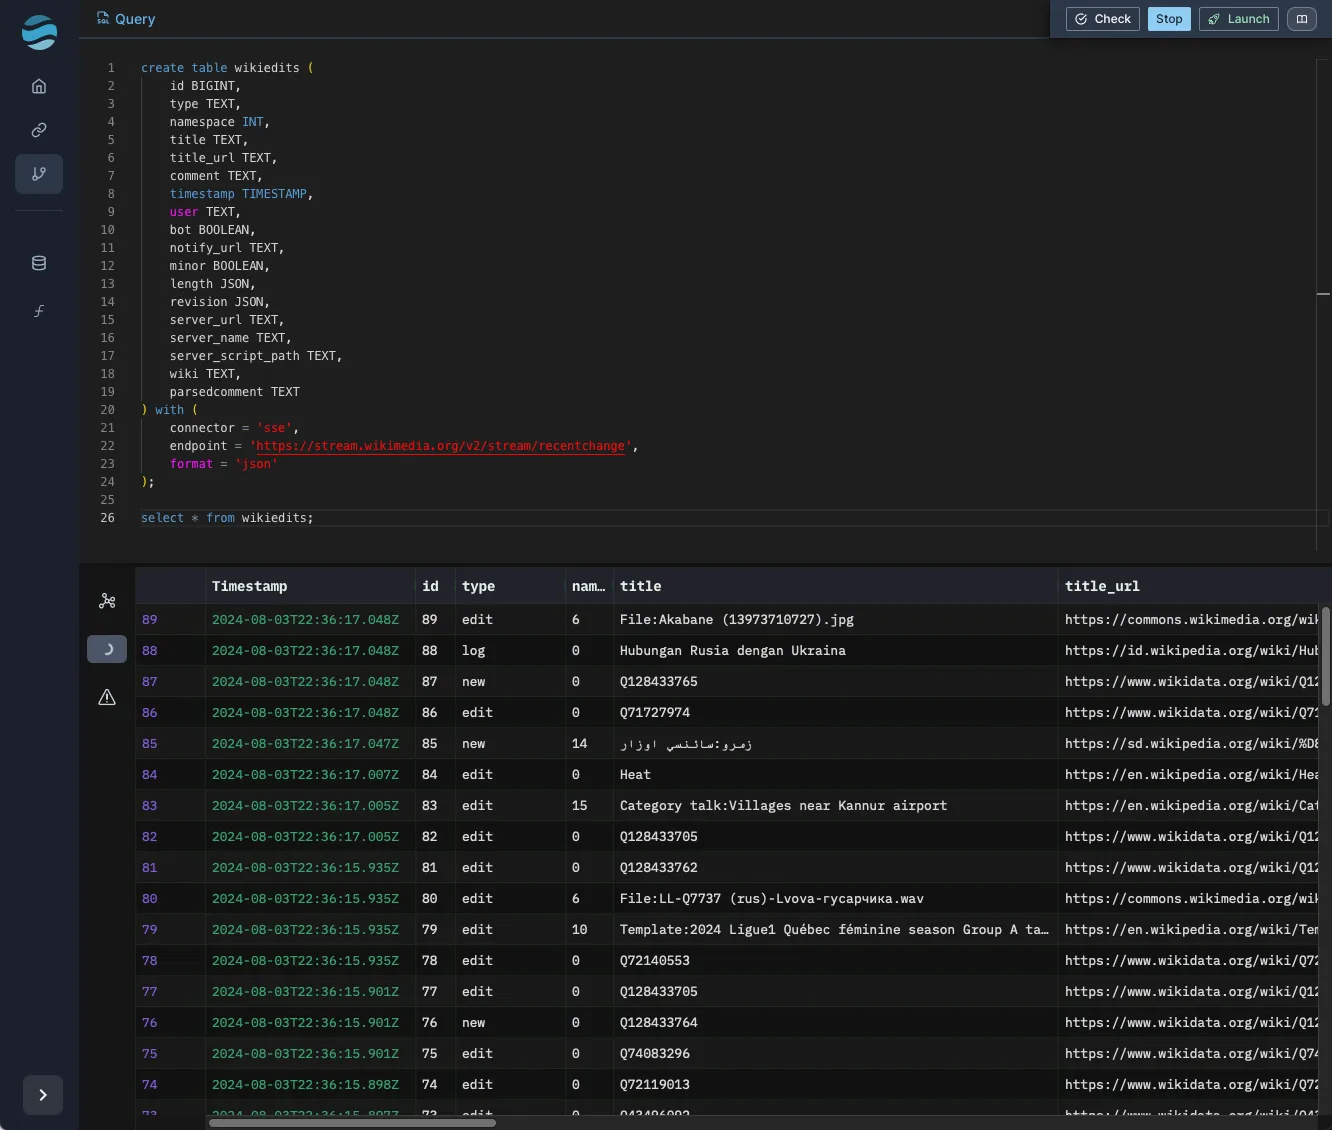
Now that we have an example document, we can turn this into a proper schema for our table:
create table wikiedits (
    id BIGINT,
    type TEXT,
    namespace INT,
    title TEXT,
    title_url TEXT,
    comment TEXT,
    timestamp TIMESTAMP,
    user TEXT,
    bot BOOLEAN,
    notify_url TEXT,
    minor BOOLEAN,
    length JSON,
    revision JSON,
    server_url TEXT,
    server_name TEXT,
    server_script_path TEXT,
    wiki TEXT,
    parsedcomment TEXT
) with (
    connector = 'sse',
    endpoint = 'https://stream.wikimedia.org/v2/stream/recentchange',
    format = 'json'
);

select * from wikiedits;
Selecting from that shows properly-parsed fields:
Top editors
Next we’ll write our actual query, which is going to find the top 10 editors over a sliding by window by number of edits. We’ll also collect some other interesting information, like the diff of the change (number of characters added minus the number removed).
For that, we’ll turn to a combination of a time-oriented window and a SQL window function. Despite both having “window” in the name they are quite different.
Time-oriented (or “streaming”) windows are unique to watermark-based stream processing engines like Arroyo. They bucket events in some way by event-time (i.e., based on when the events actually occurred) and produce outputs when a watermark—an estimate of completeness—passes the window. (For much more detail on watermarks and event-time processing, see this blog post).
The particular way events are bucketed depend on the window type; Arroyo supports three: tumbling windows which are fixed size and non-overlapping, sliding (or “hopping”) window which are fixed size and overlapping by a configurable slide, and session windows which are dynamically sized according to a maximum gap size, for example ending when a user id hasn’t been seen for 5 minutes.
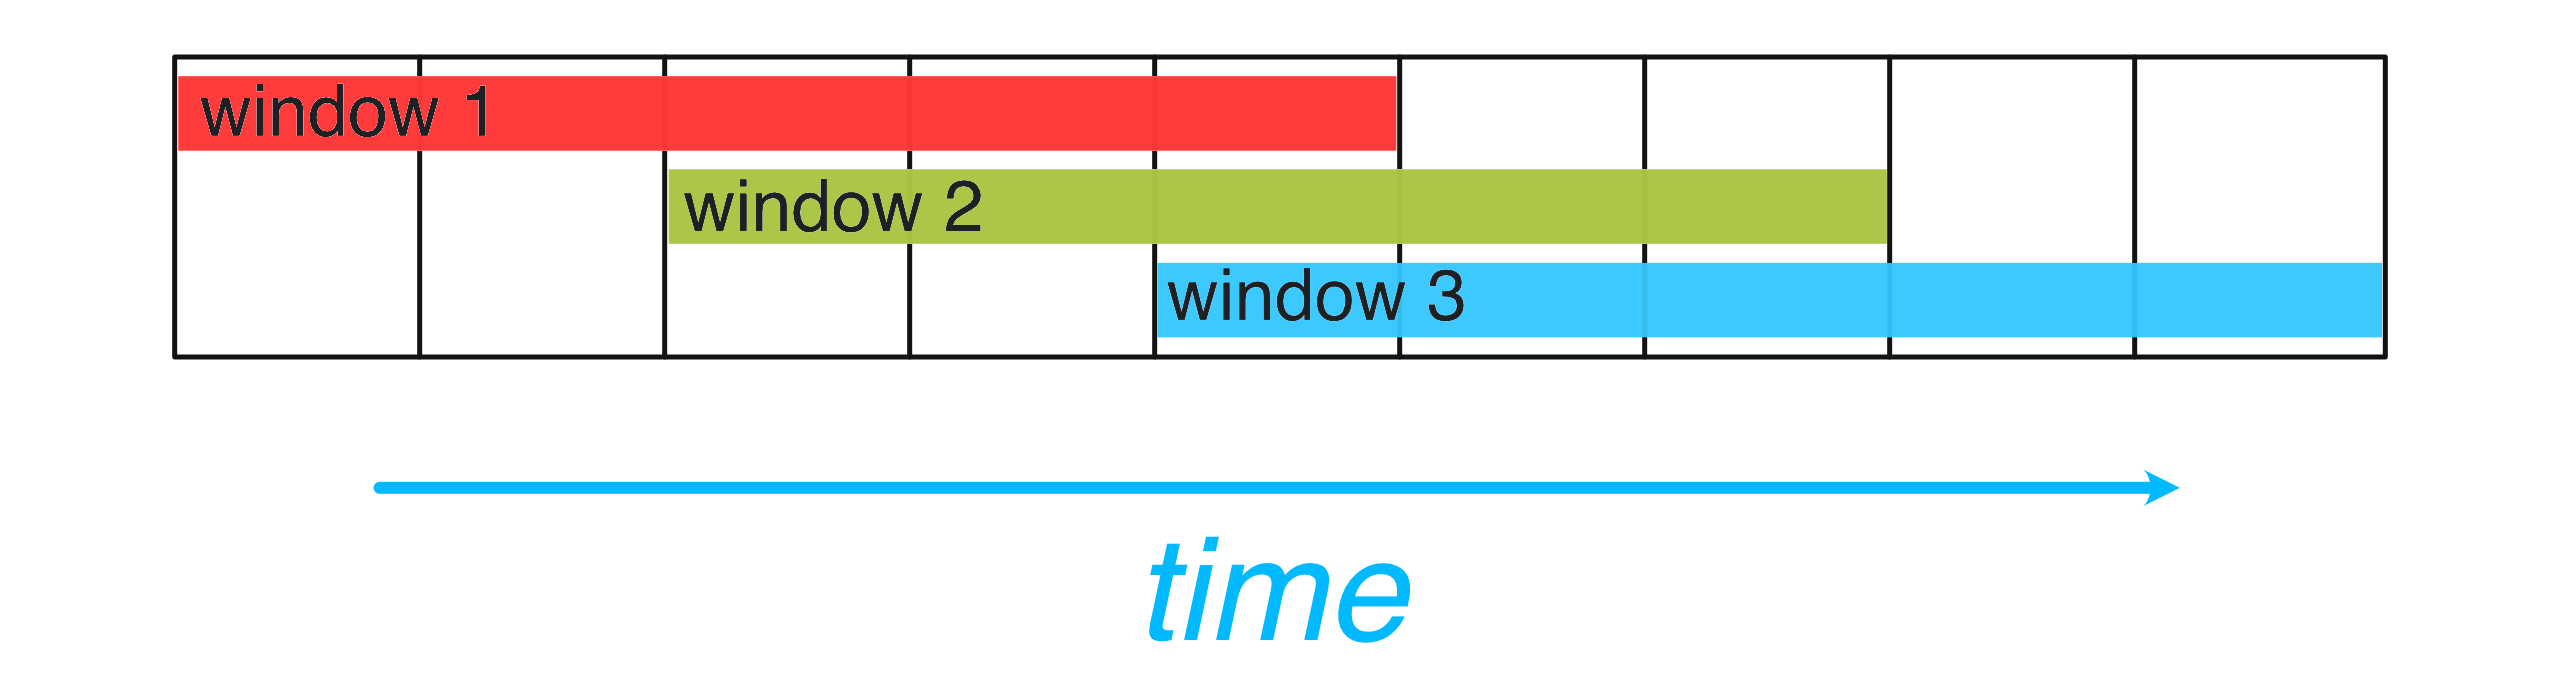
Sliding windows divide the stream into fixed-size, overlapping windows
Time-oriented windows ultimately produce a group that can be aggregated over using any SQL aggregation, like sum, count, or avg.
SQL windows on the other hand are a core part of any analytical SQL engine. Like aggregates, they operate over multiple rows, but unlike aggregates they produce an output for every input row. This property makes them useful for “top-k” style queries. We’ll use the ROW_NUMBER window function to calculate a ranking for each editor so that we can return only the top 10 (after computing the number of edits and ordering by it).
Putting that all together, we get this:
select "user", window.end as time, count, row_num from (
    select *, ROW_NUMBER() over (
        partition by window
        order by count desc
    ) as row_num
        from (
            select count(*) as count,
                "user",
                 hop(interval '5 second', interval '1 minute') as window
            from  wikiedits
            group by "user", window)
) where row_num <= 10;
Sinking our results
To actually do something with our data—other than stare at them in the Arroyo preview tab, anyways—we need one more thing: a sink; a place to write our results so that they can be used in our application.
Arroyo supports over a dozen sinks. For this pipeline we’ll use Redis, as Fly.io has an easy, built-in integration with Upstash Redis.
There are several ways Arroyo can write to Redis, all of which can be found in the Redis connector docs. We’ll use a Redis hash table, using the position of the user as the key. Setting up the table looks like this:
create table top_editors (
    time TIMESTAMP,
    user TEXT,
    bot BOOLEAN,
    count INT,
    diff INT,
    position TEXT NOT NULL
) with (
    connector = 'redis',
    type = 'sink',
    format = 'json',
    'address' = 'redis://localhost:6379',
    target = 'hash',
    'target.key_prefix' = 'top_editors',
    'target.field_column' = 'position'
);
Putting it together
With all of that done, here’s the complete query:
create table wikiedits (
    id BIGINT,
    type TEXT,
    namespace INT,
    title TEXT,
    title_url TEXT,
    comment TEXT,
    timestamp TIMESTAMP,
    user TEXT,
    bot BOOLEAN,
    notify_url TEXT,
    minor BOOLEAN,
    length JSON,
    revision JSON,
    server_url TEXT,
    server_name TEXT,
    server_script_path TEXT,
    wiki TEXT,
    parsedcomment TEXT
) with (
    connector = 'sse',
    endpoint = 'https://stream.wikimedia.org/v2/stream/recentchange',
    format = 'json'
);

create table top_editors (
    time TIMESTAMP,
    user TEXT,
    bot BOOLEAN,
    count INT,
    diff INT,
    position TEXT NOT NULL
) with (
    connector = 'redis',
    type = 'sink',
    format = 'json',
    'address' = 'redis://localhost:6379',
    target = 'hash',
    'target.key_prefix' = 'top_editors',
    'target.field_column' = 'position'
);

insert into top_editors
select window.end as time, "user", bot, count, diff, cast(row_num as TEXT) from (
    select *, ROW_NUMBER() over (
        partition by window
        order by count desc
    ) as row_num
        from (
            select count(*) as count,
                "user",
                sum(coalesce(cast(extract_json(length, '$.new')[1] as int), 0)
                  - coalesce(cast(extract_json(length, '$.old')[1] as int), 0)) as diff,
                bot,
                hop(interval '5 second', interval '1 minute') as window
            from  wikiedits
            group by "user", bot, window)
) where row_num <= 10;
We can preview it in the pipeline UI to see the results (note that preview doesn’t write to sinks by default), or we could click “Launch” to run it in on our local cluster. However, we’re going to instead run it as a pipeline cluster using arroyo run.
Write that query to a file, for example query.sql. Then start it in a pipeline cluster with
$ arroyo run query.sql
INFO arroyo::run: Job transitioned to Scheduling
INFO arroyo::run: Job transitioned to Running
INFO arroyo::run: Pipeline running... dashboard at
  http://localhost:61670/pipelines/pl_z4v74Tqa15
(Note this will require a local Redis instance running on the default port.)
Then we can see the results by querying Redis
$ redis-cli
127.0.0.1:6379> HGETALL top_editors
 1) "8"
 2) "{\"time\":\"2024-08-04T22:12:15\",\"user\":\"Twofivesixbot\",\"bot\":true,\"count\":27,\"diff\":-11010,\"position\":\"8\"}"
 3) "3"
 4) "{\"time\":\"2024-08-04T22:12:15\",\"user\":\"GeographBot\",\"bot\":true,\"count\":47,\"diff\":16647,\"position\":\"3\"}"
 5) "4"
 6) "{\"time\":\"2024-08-04T22:12:15\",\"user\":\"\xc3\x80ncilu bot\",\"bot\":true,\"count\":36,\"diff\":1464,\"position\":\"4\"}"
 7) "10"
 8) "{\"time\":\"2024-08-04T22:12:15\",\"user\":\"DMbotY\",\"bot\":true,\"count\":22,\"diff\":0,\"position\":\"10\"}"
 9) "5"
10) "{\"time\":\"2024-08-04T22:12:15\",\"user\":\"Strainubot\",\"bot\":true,\"count\":33,\"diff\":11045,\"position\":\"5\"}"
11) "9"
12) "{\"time\":\"2024-08-04T22:12:15\",\"user\":\"Emijrpbot\",\"bot\":true,\"count\":25,\"diff\":10190,\"position\":\"9\"}"
13) "1"
14) "{\"time\":\"2024-08-04T22:12:15\",\"user\":\"Cewbot\",\"bot\":true,\"count\":56,\"diff\":20930,\"position\":\"1\"}"
15) "2"
16) "{\"time\":\"2024-08-04T22:12:15\",\"user\":\"Mr.Ibrahembot\",\"bot\":true,\"count\":49,\"diff\":205294,\"position\":\"2\"}"
17) "7"
18) "{\"time\":\"2024-08-04T22:12:15\",\"user\":\"DaxServer\",\"bot\":false,\"count\":28,\"diff\":290349,\"position\":\"7\"}"
19) "6"
20) "{\"time\":\"2024-08-04T22:12:15\",\"user\":\"Reinheitsgebot\",\"bot\":true,\"count\":29,\"diff\":849,\"position\":\"6\"}"
The Web App
We’ve got our data, but querying redis-cli isn’t a great user experience. So let’s build a simple web app to show the results to our users as an auto-updating table. We’ll use Flask, a simple Python microframework, along with the HTMX framework to perform the real-time updates.
Create a new directory, for example webapp.
We’ll create two HTMX templates
<!DOCTYPE html>
<html lang="en">
<head>
    <meta charset="UTF-8">
    <meta name="viewport" content="width=device-width, initial-scale=1.0">
    <title>Top Wikipedia Editors</title>
    <script src="https://cdnjs.cloudflare.com/ajax/libs/htmx/1.9.2/htmx.min.js"></script>
    <style>
        table { border-collapse: collapse; width: 100%; }
        th, td { border: 1px solid #ddd; padding: 8px; text-align: left; }
        tr:nth-child(even) { background-color: #f2f2f2; }
        th { background-color: #4CAF50; color: white; }
    </style>
</head>
<body>
    <h1>Top Wikipedia Editors</h1>
    <table>
        <thead>
            <tr>
                <th>Position</th>
                <th>User</th>
                <th>Edit Count</th>
                <th>Diff</th>
                <th>Time</th>
            </tr>
        </thead>
        <tbody id="editors-list" hx-get="/refresh" hx-trigger="every 5s">
            {% include 'table_content.html' %}
        </tbody>
    </table>
</body>
</html>{% for editor in editors %}
<tr>
<td>{{ editor.position }}</td>
<td>
{{ editor.user }}
{% if editor.bot %}
🤖
{% endif %}
</td>
<td>{{ editor.count }}</td>
<td>{{ editor.diff }}</td>
<td>{{ editor.time }}</td>
</tr>
{% endfor %}and a Python app file that will call out to Redis to read the results while rendering the table:
from flask import Flask, render_template
import redis
import json
import os

app = Flask(__name__)

# Connect to Redis
r = redis.Redis(host='localhost', port=6379, db=0, decode_responses=True)

def get_editors_data():
    editors_data = r.hgetall('top_editors')
    editors = [json.loads(data) for data in editors_data.values()]
    editors.sort(key=lambda x: int(x['position']))
    return editors

@app.route('/')
def index():
    editors = get_editors_data()
    return render_template('index.html', editors=editors)

@app.route('/refresh')
def refresh():
    editors = get_editors_data()
    return render_template('table_content.html', editors=editors)

if __name__ == '__main__':
    app.run(debug=True)
Finally, we’ll add a requirements.txt file to install the necessary dependencies:
flask
redis
and then we can run it:
# This uses virtualenv to create a local environment, but you could also use
# pipenv or poetry
$ python3 -mvenv .venv
$ source .venv/bin/activate
$ pip install -r requirements.txt
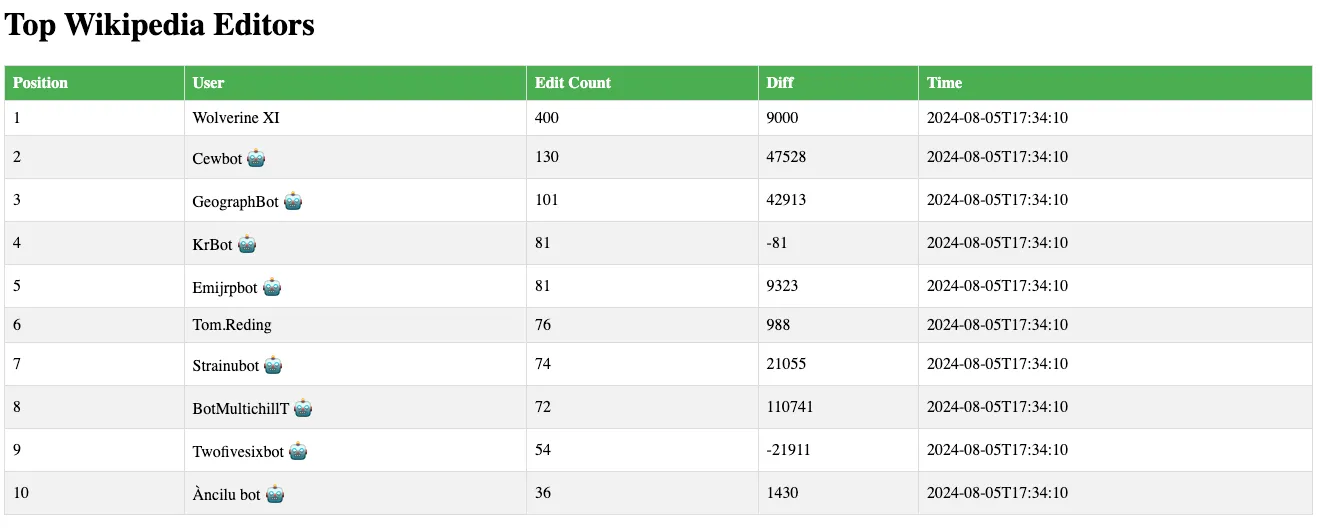
$ python app.pyWith everything running, we should now see a visualization of the data running at http://localhost:5000.
Deploying to Fly
Now that we’ve validated that our pipeline and Web UI work, how can we run it in production? Generally this would mean rolling out Kubernetes and a distributed cluster for our streaming framework. But with Arroyo’s pipeline clusters, we can run a fault-tolerant, production-quality pipeline using a simple serverless provider like Fly.
And even better, thanks to Arroyo’s low resource usage, we can run within Fly’s free tier! (Although note that there is no free tier for Redis or Tigris, so you’ll need to pay for those services.)
The Fly setup
There are several ways we could structure our Fly project. Fly divides infrastructure into units called apps, which each have their own image and configuration. For this example, we’ll create two Fly apps: one for the Arroyo pipeline, and one for the Flask application1.
Before getting started, you’ll need the fly CLI (https://fly.io/docs/flyctl/install/) and a Fly.io account.
We’ll start with the pipeline. Create a directory (called “arroyo”, for example) for our app configuration. Then we can create the application by running
$ fly launch --no-deploy --image ghcr.io/arroyosystems/arroyo:0.11This will ask whether we want to tweak the settings before launching—type y and enter to open up the configuration editor. Enter the following settings (choosing a unique name for your app):
This will create a Tigris Object Storage bucket for our checkpoints, and a Redis database to store our outputs.
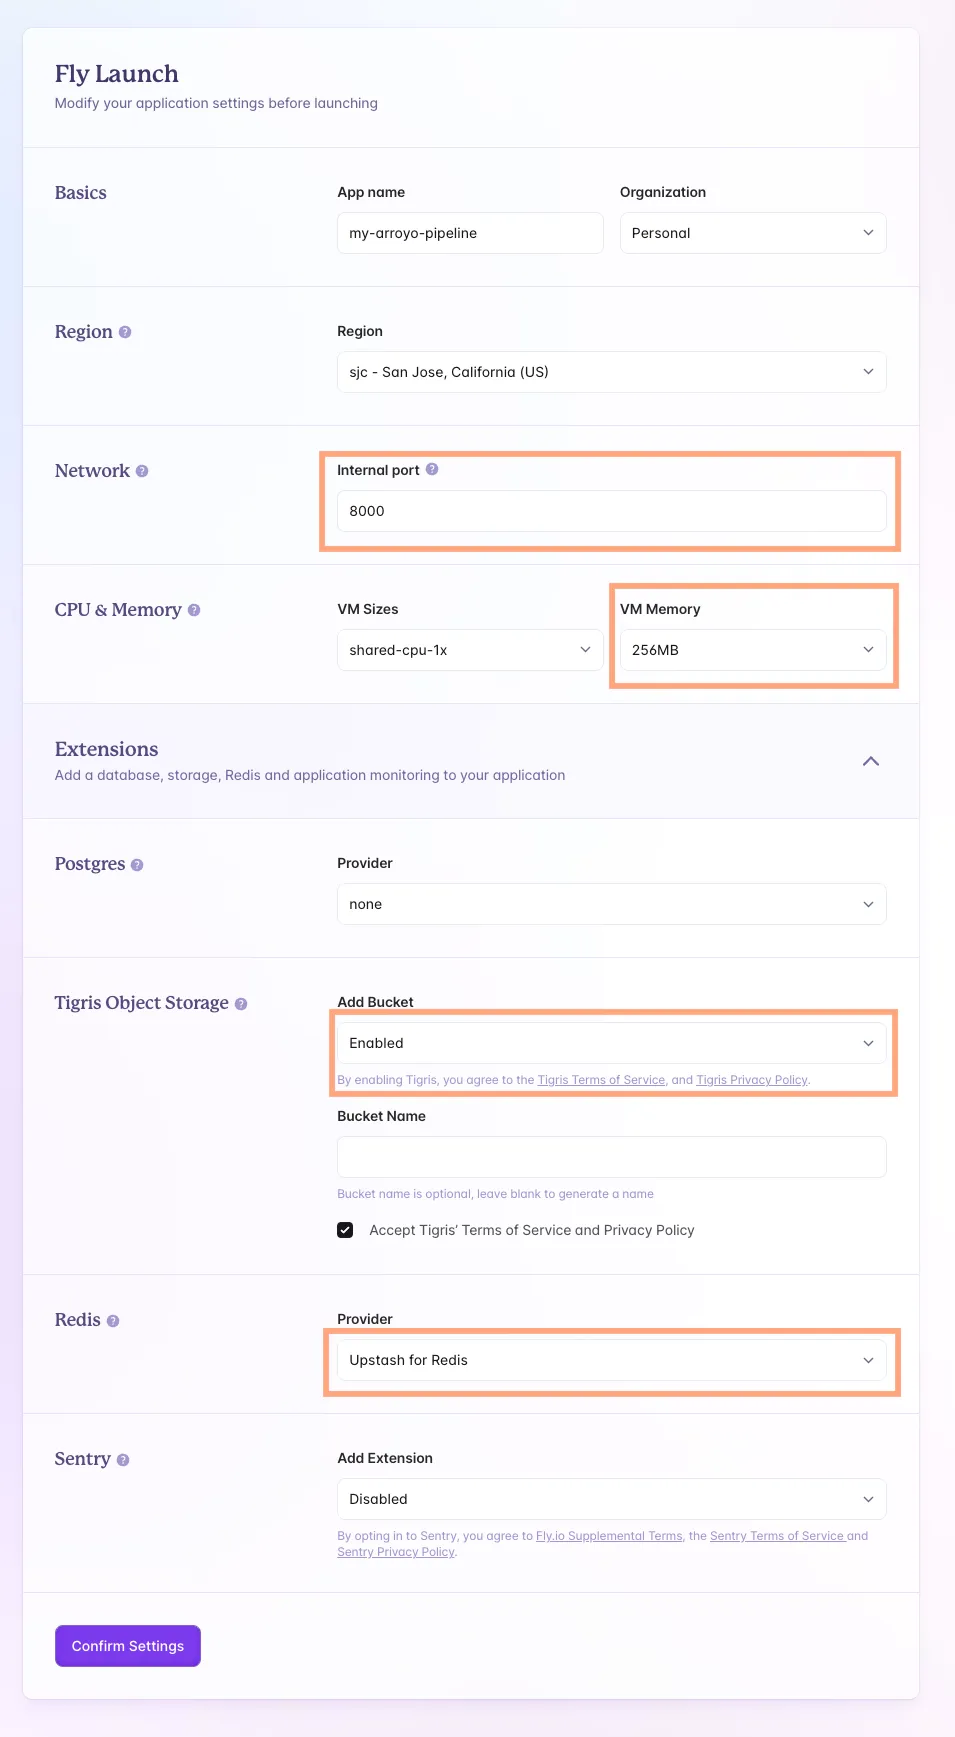
Click “Confirm settings.” This will output some information about the Redis and Tigris setups. Take note of the redis URL (which will look like redis://default:809a09f184a90e7b5ad8c54d06a40321@fly-my-arroyo-pipeline-redis.upstash.io:6379) AWS_ENDPOINT_URL_S3, BUCKET_NAME, and produces a fly.toml file which configures our application.
This will also produce a fly.toml file in our current directory, which will configure our application. We still need to make a few more tweaks here though, so open that up in your favorite editor and update it as follows
# This should be set to whatever your app name is
app = 'my-arroyo-pipeline'
primary_region = 'sjc'

[build]
image = 'ghcr.io/arroyosystems/arroyo:0.11'

[http_service]
internal_port = 8000
force_https = true
# The pipeline will run continuously, so we disable auto stop
auto_stop_machines = 'off'
# Similarly, we always expect to have one pipeline worker
auto_start_machines = false
min_machines_running = 1
processes = ['app']

[experimental]
# We need to use the "run" argument to the Arroyo binary for a pipeline
# cluster
cmd = ["run"]

[env]
# Set this to s3::{{AWS_ENDPOINT_URL_S3}}/{{BUCKET_NAME}/wiki-editors
ARROYO__RUN__STATE_DIR = "s3::https://fly.storage.tigris.dev:443/empty-star-1118/wiki-editors"
ARROYO__API__RUN_HTTP_PORT = 8000

[[vm]]
size = 'shared-cpu-1x'
Next we’ll save the query to our directory as query.sql so that it can be deployed with our application. We’ll need to make a few modifications to the sink configuration. Refer back to the Redis URL and find the hostname (the part after the @), and set that as the redis address; for example redis://fly-arroyo-fly-redis.upstash.io:6379. We’ll also need to set the username to default and the password to {{ REDIS_PASSWORD }}.
...

create table top_editors (
    time TIMESTAMP,
    user TEXT,
    bot BOOLEAN,
    count INT,
    diff INT,
    position TEXT NOT NULL
) with (
    connector = 'redis',
    type = 'sink',
    format = 'json',
    'address' = 'redis://fly-arroyo-fly-redis.upstash.io:6379',
    username = 'default',
    password = '{{ REDIS_PASSWORD }}',
    target = 'hash',
    'target.key_prefix' = 'top_editors',
    'target.field_column' = 'position'
);
...
To make the redis password available to the pipeline, we need to set it as a secret. Find the password from the redis URL output earlier (it’s the part of the URL after the colon) and set it as a secret:
$ fly secrets set REDIS_PASSWORD=809a09f184a90e7b5ad8c54d06a40321Now we’re ready to deploy our pipeline with the fly cli:
$ fly deploy -e ARROYO__RUN__QUERY="$(cat query.sql)" --ha=falseWe’re passing two arguments to the fly deploy command:
- the
ARROYO__RUN__QUERYsets the query the pipeline will be executing, pulling it from the query.sql file we created —ha=falsetells Fly to only run a single instance of the pipeline
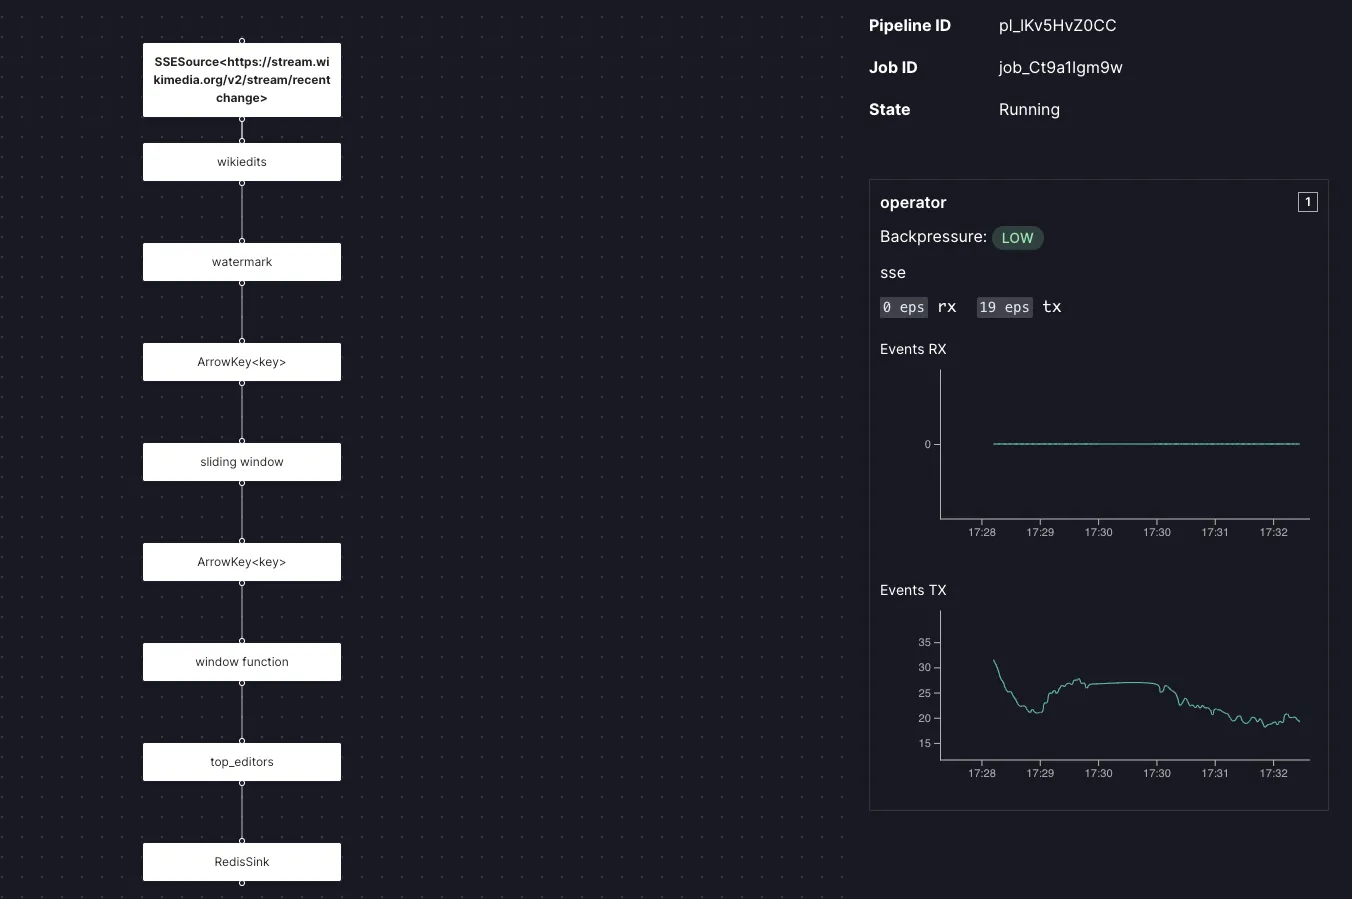
After a couple of minutes, the pipeline should be running. You can open the Web UI at the URL shown at the end of the deploy output (for example https://my-arroyo-pipeline.fly.dev/). Navigate the the pipelines tab and click the pipeline. It should be running and consuming events
Note that this method of deployment exposes the Arroyo Web UI to the internet, which is not secure. Anyone who knows—or can guess—your app name can access the UI, which would allow them to control your pipelines and potentially expose secrets.
For production deployments the Arroyo app should be configured to run on the private network. See https://fly.io/docs/networking/private-networking/ for more details on how to set this up.
Deploying the Web UI
Next, we’ll deploy the Web UI. This is very easy, as Fly has built-in support for deploying Flask applications.
We’ll need to make a small change to the app.py file to configure it to use the hosted redis:
r = redis.Redis(host='{REDIS_HOST}',
  port=6379, username='default', password=os.environ["REDIS_PASSWORD"], db=0, decode_responses=True)
Replace {REDIS_HOST} with the same host as you did for the pipeline earlier, for example fly-arroyo-fly-redis.upstash.io (don’t include the redis:// or the port).
Now we’ll create application by running the following command in the webapp directory:
$ fly launch --no-deployThis time you can leave the configurations as default, although you may choose to scale down the node size and choose a different app name. The fly command should identify it as a Flask application and generate an appropriate fly.toml and Dockerfile.
All we need to do now is set the REDIS_PASSWORD secret as before, for example:
$ fly secrets set REDIS_PASSWORD=809a09f184a90e7b5ad8c54d06a40321And we’re ready to deploy:
$ fly deployAnd that’s it! Your application should be ready to go. Open it up at the link provided by the deploy command.
What’s next
This is a simple example of how we can build real-time data pipelines with no fixed infrastructure and all of the easy operational power of Fly. Complex, distributed tooling is no longer necessary for many companies to do stream processing. You just need SQL and serverless compute.
Where to go from here? There are many interesting ways we could analyze the Wikipedia data with Arroyo. For example:
- What are the most frequently edited articles?
- Can we detect edit wars by finding article being edited by different users in quick succession?
- Can we block vandalism by looking for users whose edits are quickly reverted?
If you build anything interesting with Arroyo and Fly, we’d love to hear about it! Come join the friendly folks on the Arroyo Discord.
Footnotes
Alternatively, we could choose to pack both Arroyo and the Flask application into a single Fly app by building a custom Docker image. This could save on machine costs and could allow the streaming pipeline to be scaled to zero when there are no requests to the site. ↩